
 Ahead of the 42nd Lunar & Planetary Science Conference, we highlighted selected presentations related to lunar science:
Ina, a unique 2.8 km-wide feature with a distinctly blue optical component originally spotted by Apollo astronauts from orbit. LROC Narrow Angle Camera observation M119815703, from 41.15 kilometers, orbit 2791, February 3, 2010; resolution 0.48 meters per pixel, incidence angle 56° [NASA/GSFC/Arizona State University].
 THE SPECTRAL PROPERTIES OF INA: NEW OBSERVATIONS FROM THE MOON MINERALOGY MAPPER #2499.
Isaacson, Petro & Boardman et al
Planetary Science Institute, Brown University; NASA Goddard; AIG, LLC; U. Maryland; U. Tennessee
Planetary Science Institute, Brown University; NASA Goddard; AIG, LLC; U. Maryland; U. Tennessee
Introduction: The unusual morphology and appearance of Ina, originally referred to as ‘D-Caldera’ because of it’s unique shape (Figure 1), have been of interest to lunar scientists since it was first identified in Apollo images [1, 2]. Early studies of this 2.8 km wide depression interpreted it to be a lunar caldera or collapse pit, based in part on its location near the summit of a broad, low-relief dome [1-4]. The interior of Ina contains smooth mounds and small plateaus of positive relief surrounded by brighter and rougher, lower-lying floor materials [1-4]. Several lines of evidence suggest the presence of relatively fresh surfaces within the floor of the Ina depression [5,6]. These factors include the preservation state of small-scale relief, the small number of superposed craters and an apparent lack of significant space weathering associated with the bright interior regions. Based on these properties, portions of Ina’s interior have been interpreted as being less than 10 Myr old and perhaps still forming as the result of episodic outgassing from the deep interior of the Moon [6].
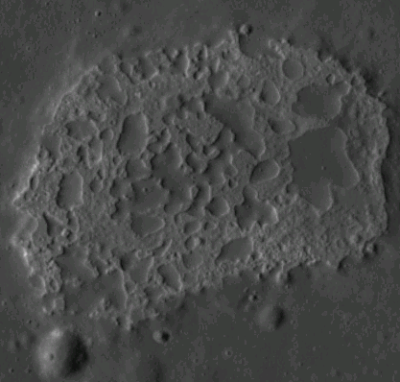
LPSC XLII (2011) Figure 1. Kaguya Terrain Camera morning image of Ina (light is from the east, mound features have positive relief).
Recent Narrow Angle Camera (NAC) images returned by the Lunar Reconnaissance Orbiter (LRO) are revealing the morphology of Ina at resolutions of up to 0.5 m/pixel [7]. While crater densities observed in this new data indicate an average age > 10 MY for the lower floor unit as a whole [7], the new data also show steep slopes and boulder fields down to the limit of resolution that may represent smaller areas of more recent disturbance. Reflectance data recently acquired by the Moon Mineralogy Mapper (M3) are assessed here to investigate the spectral properties and origin of these bright floor materials within Ina. M3 Data: The M3 imaging spectrometer was a guest instrument on India’s Chandrayaan-1 mission which launched on October 22, 2008 and mapped the lunar surface through August of 2009. M3 data of Ina and surrounding deposits were acquired twice in global mapping mode, which covered the wavelength range of ~430 to 3000 nm in 85 spectral bands. The first acquisition occurred in Optical Period 1b (OP 1b) at a spatial resolution of 140 m/ pixel and a phase angle of ~52 degrees. Preliminary M3 observations of Ina from this data acquisition are presented here. To provide an improved context for interpretation, M3 data have been co-aligned with Terrain Camera data from the Kaguya satellite (Figure 1) and topographic data acquired by the Lunar Orbiter Laser Altimeter (LOLA) aboard LRO.
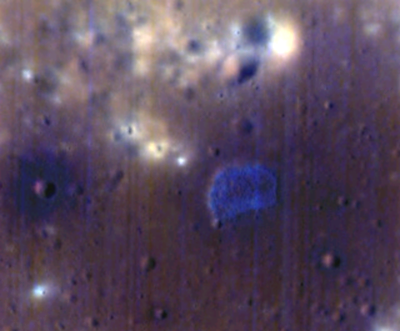
LPSC XLII (2011) Figure 2. M3 mapper color composite (blue=460nm, green=1580nm, red=2780nm) overlaid on a Kaguya Terrain Camera image. Ina stands out from surrounding deposits due to its bright reflectance at blue wavelengths.
M3 Observations of Ina: Apollo 17 astronauts first observed the relatively blue color of the ‘rough, blocky’ floor materials in Ina that were described as having a ‘very light bluish-gray’ tint relative to surrounding materials, with raised bumps that were similar in color to surrounding terrain [8]. Figure 2 shows an M3 image of Ina in which these floor materials stand out relative to surrounding materials and the elevated interior mounds due to their bright reflectance in blue wavelengths of light (M3 460 nm band).
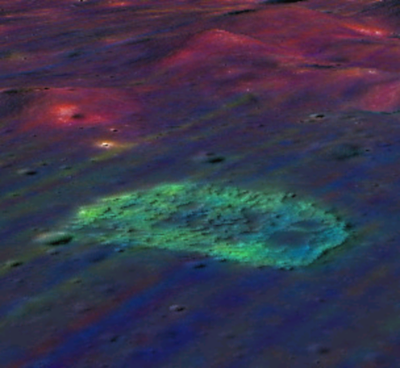
LPSC XLII (2011) Figure 3. Perspective view of Ina looking northwest, based on co-aligned 3M (Chandrayaan), Kaguya & LOLA (LRO) topographic data. Bright optically immature deposits on the floor of Ina appear green in this M3 color ratio composite due to a strong 1 micro-meter ferrous band relative to surrounding deposits (b=460/750nm, g=750/990, R=750/460nm) [NASA/JAXA/ISRO].
Figure 3 shows an example of a M3 ratio composite as a perspective view using LOLA topographic information. As in Figure 2, this image has been overlaid on Kaguya data to provide greater morphologic context for interpretation of the M3 reflectance data. This M3 data demonstrates that the strong ferrous absorption associated with relatively unweathered materials identified in previous studies [6] are related to bright floor materials within Ina, rather than broad topographic slopes. In contrast, the raised mounds within Ina lack a spectral signature associated with freshly exposed surfaces. Figure 4 compares floor materials within Ina displaying the strongest mafic bands to optically immature (‘fresh’) mare craters in Mare Serenitatis and Mare Tranquillitatis (low and high-titanium mare basalts, respectively). For these comparisons, the least weathered 1% of mare materials by surface area were sampled from each basalt type based models of mare maturity [9, 10]. The least-weathered floor materials within the Ina depression (average of eight 140m x140m pixels) are found to resemble very fresh materials within recent craters in Mare Tranquillitatis.
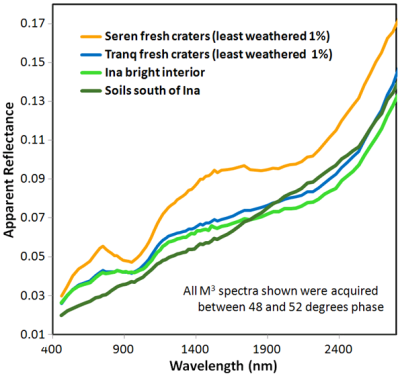
LPSC XLII (2011) Figure 4. A 3M reflectance spectrum of the brightest interior regions are compared to surrounding soils, as well as fresh mare craters in high and low titanium mare basalts.
Summary and Future Work: Preliminary examination of M3 data for the Ina structure is consistent with previous studies [6] that have identified relatively unweathered high-titanium basalts within the blocky floor materials. These results support the interpretation that floor materials within Ina have been disturbed recently enough to be spectrally similar to small, fresh mare craters within Tranquillitatis. Calibrations and analysis of the M3 Ina data are on-going and have yet to be fully corrected for thermal emission and scattered light. Future investigations will more fully explore these new data and associated lunar features for maturity and mineralogical information as well as the possible presence of volatile components. No significant signs of volatile components have been observed in preliminary analysis of these data.
References: [1] Whitaker, E. A. (1972), NASA SP-289, 25, 84-85, , [2] El-Baz, F and A. W. Warden (1972) NASA SP-289, 25, 1-25 [3] El-Baz, F. (1973) NASA SP-330, 30, 13-17. [4] Strain, P. and F. El-Baz (1980), PLPSC, 2437-2446. [5] Schultz, P.H. (1991), LPI Techn. Rept. 91-03, 37-38, [6] Schultz, P.H. et al. (2006), Nature, 444, 184-186. [7] Robinson, M. et al. (2010), LPSC 41, 2592 [8] Evans, R. E. and F. El-Baz (1972) NASA SP-289, 28,1-32. [9] Staid, M. and C. M. Pieters (2000), Icarus, 145, 122-139 [10] Wilcox et al. (2005), JGR, 110, E11001.
- 42nd Lunar and Planetary Science Conference (2011)
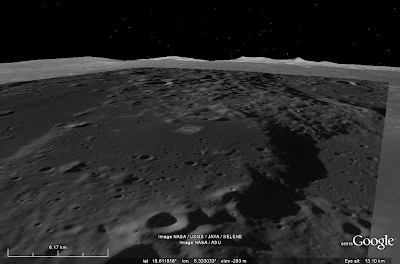
The LROC NAC frame at the beginning of this post superimposed on an LROC WAC monochrome mosaic that is, in turn, overlaid upon the lunar digital elevation model available to users of the Google Earth application (>v.5), looking northwest toward the eastern range of the Montes Apenninus more than 100 km away. This perspective is similar to that seen in Figure 3 -LPSC XLII (2003) #2499.
1 comment:
Its very informative i think its very much nice information all humans.
Thank you for sharing..
Post a Comment